
The International Campaign for Responsible Technology (ICRT) recently shared a good resource from the Water Utility Report for understanding the dynamics of water and data centers. A lot of the conversation about what are used by data centres focusses on what happens inside the walls of those centres where servers are at work. That’s important, of course, but it’s only part of the picture. As the Water Utility Report points out:
“If you only look at data centers, you are looking at the visible part of AI’s water footprint. Data centers are local, tangible, and politically visible. But if your real concern is water quality, the more important question may be upstream: what happens before the server ever reaches the data center? That question leads to semiconductors.” (Water Utility Report 2026)
The point being made here resonates with a key insight in the field of discard studies: most of the pollution and waste, by far, happens before consumers or households have even purchased things from which post-consumer waste will arise. Like with data centers, post-consumer and household discards–like garbage in a pail under the sink, paper and plastics in a recycling bin, or kitchen waste in a compost pile–are very local, very tangible. Because people tend to deal with these forms of discard as part of mundane, every day life they are very familiar and, because they are familiar, they are often mistaken for waste in a more general sense. They are not. Plenty of work in the field of discard studies shows that the largest magnitudes of pollution and waste of arising from industrial systems occur in ‘upstream’ of consumers and household purchases. ‘Upstream’ and ‘downstream’ can be useful analytical frames for analyzing how and where pollution and waste arise, with what effects, for whom and what, and under what conditions. Let’s look at a few examples to see how the upstream / downstream framework can be analytically useful.
There’s an (in)famous statistic in discard studies about household waste: household (or post consumer) waste accounts for 3-10 percent of overall waste arising. The flipside of that statistic is that 90-97 percent of waste occurs before household or consumers purchase stuff. Yes, there is nuance in these numbers that my co-author and I get into in our book (open access available here: https://direct.mit.edu/books/oa-monograph/5337/Discard-StudiesWasting-Systems-and-Power). The point is that it’s easy to mistake our every day experiences with household waste with waste in general. The stuff you and I are throwing away is unpleasant, it stinks, and is icky. But as repellent as we may find it, it’s hardly coextensive with overall waste arising.
A lot of my research is about e-waste. One of the key points I try to stress in that research is that when he waste is treated as a post-consumer problem, most of the problem is missed and the solutions that are typically put forward – – post consumer recycling, reuse and repair – – do not match up with the largest parts of the pollution and waste problems. Here’s a quick visual that helps convey what I mean, using data available for Arizona (I’ll get to why Arizona in a moment).
According to this site (EWaste Phoenix 2026), 200,000 metric tons of post consumer e-waste arise in Arizona annually. Meanwhile, according to the US Geological Survey, a total of 1,903,000,000 metric tons (United States Geological Survey, n.d.) mine waste arose at a single tailings pond at a single Arizona copper mine (Sierrita-Esperanza) over its roughly 60 year operational history — or about 31,716,666 metric tons per year of operation. That means that the waste arising at this single tailings pond at this single mine each year was two orders of magnitude larger than the amount of post consumer e-waste arising each year in Arizona. Differences in orders of magnitude can be difficult to comprehend, so here is a way to visualize what a difference of two orders of magnitude looks like:
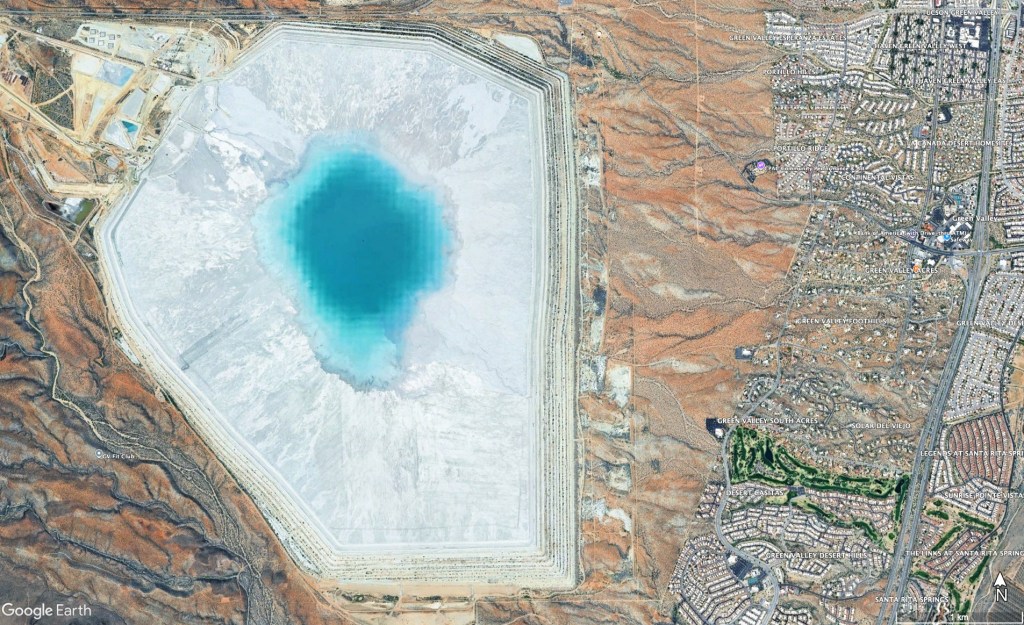
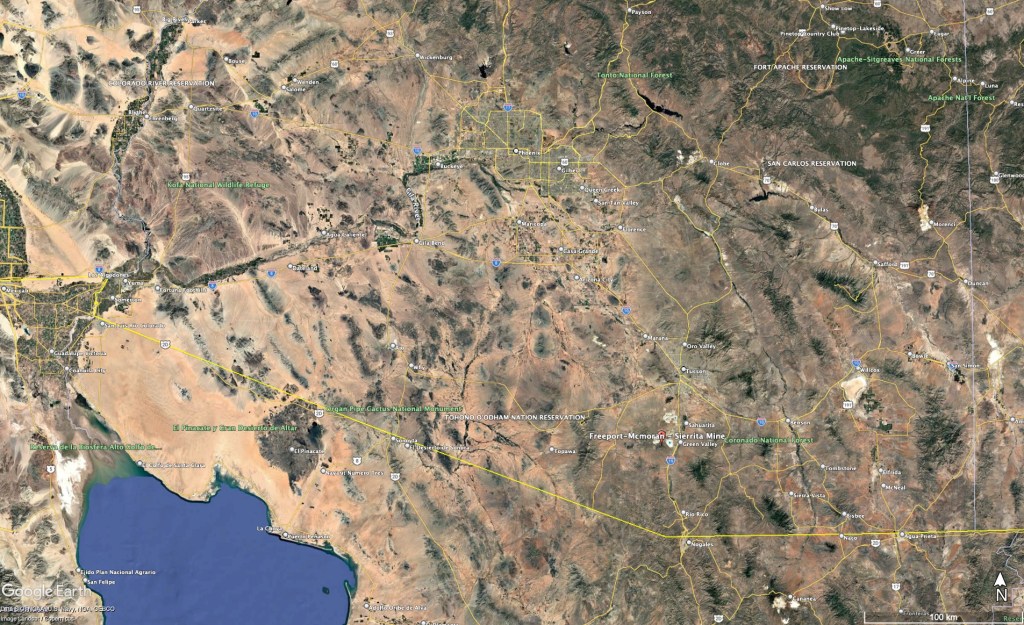
The top image shows the single tailings pond measured by USGS at Sierrita-Esperanza mine add a map scale of 1 km (look for the scale bar in the bottom right hand corner of the image). The image below it uses a map scale of 100 km (2 orders of magnitude different) to show the same scene. You can see the Sierrita-Esperanza tailings pond towards the lower third of the image near the town of Green Valley and the city of Phoenix near the top of the image. By visually comparing these two images, hopefully it is apparent how even if all of the 200,000 metric tons of post consumer e-waste arising annually (top image) were perfectly recycled it would never add up to 31,716,666 metric tons arising annually at the single tailings pond at this single mine. It should go without saying, however, that just because these orders of magnitude of difference exist is not evidence that post-consumer recycling should not be done. What these orders of magnitude of difference do show is that post-consumer recycling is mismatched as a solution to the upstream waste arising from mining a mineral — copper — of which the electronics industry is the second most important consumer of after the building and construction industry.
No amount of post-consumer/household recycling can make up for the waste arising upstream in the mining for, or manufacturing of, electronics. The issue here is more than one about differences of magnitude. The kinds of interventions – – policy, regulation, legislation and so forth – – that are relevant for the mining sector are likely to be quite different than those that are relevant for post-consumer and household discards. For example, in the United States, “titles to mining rights on US Federal land can, to this day, be had for between $2.50 and five dollars per acre, literally the same nominal price paid in 1872 when the law was first passed” (https://electronicplanet.xyz/2024/12/12/what-is-a-sacrifice-zone/). Think about what that dollars per acre figure really means. According to this inflation calculator, which only goes back to 1913, 5.00 US dollars in 1913 is equivalent to over $168 dollars today. So to spell it out, the cost per acre of land for mining under US law has declined by more than 3,200 percent since 1913. It’s waaaaaaaaaaay cheaper today to buy land for a mine in the United States than it was in the 19th century. If, however, US mining laws were changed to, say, reflect inflation and the costs associated with mitigating and eliminating mining pollution/waste to reflect those costs in current dollars, that could be a policy change that intervenes in the right place ‘upstream’ to have a meaningful impact on waste arising from mining.
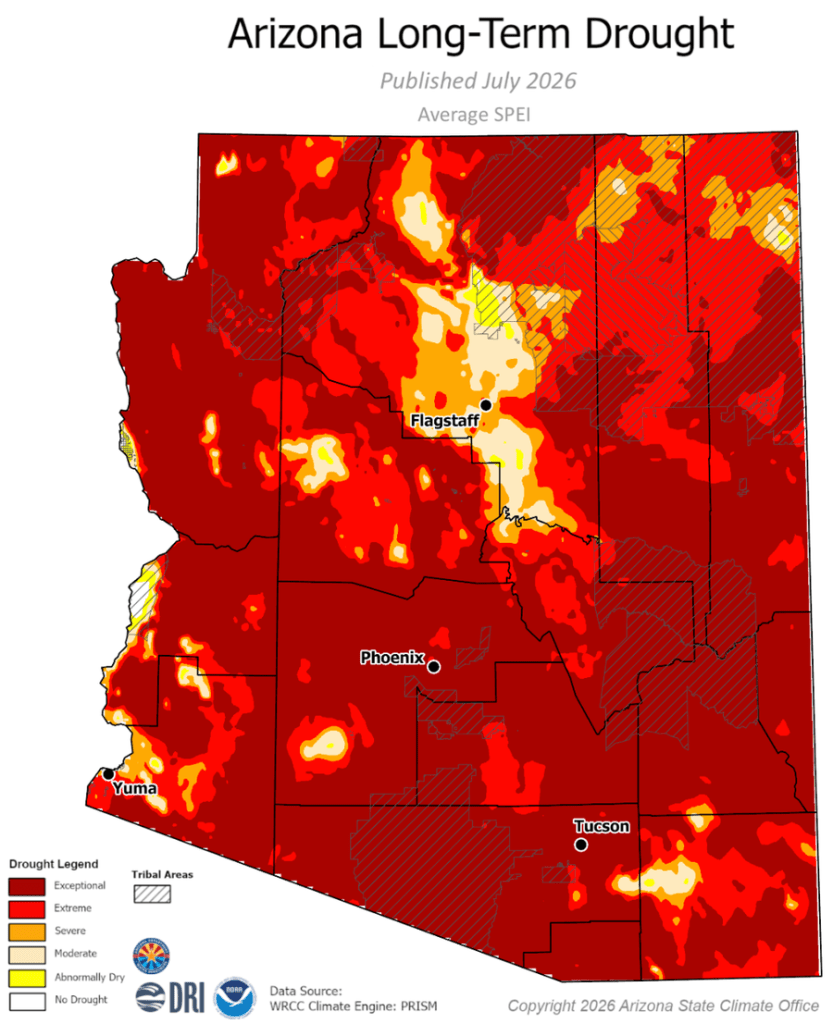
Arizona (and the US desert Southwest more broadly) has been a production zone for both agriculture and semiconductors for decades. The Colorado River basin collects and distributes the water necessary for those production activities along with all other water uses – everything from drinking water to sewage, etc. But in 2021 the US Bureau of Reclamation made the first ever “shortage declaration” for the entire Colorado River basin. Then, just last week the same federal agency announced plans to cut water use in cities and farms within the basin, “by hundreds of billions of gallons” (Bolster 2026). The cuts, if implemented, would take place over 10 years but Arizona’s Department of Water Resources has already publicly denounced the plan as “unacceptable” (Arizona Department of Water Resources 2026). Under the proposed plan reductions in water from the Colorado system to Arizona would amount to 3,000,000 acre feet per year. The state claims those reductions, “would devastate Arizona’s water users and its economy” (Arizona Department of Water Resources 2026). The state is, indeed, experiencing exceptional long-term drought according to its own State Climate Office (see image below). So how might the concept of ’upstream’ add to an understanding of the situation? Well, let’s look a little more closely at how water, semiconductors, and data centres overlap in the Colorado River basin and in Arizona more specifically.
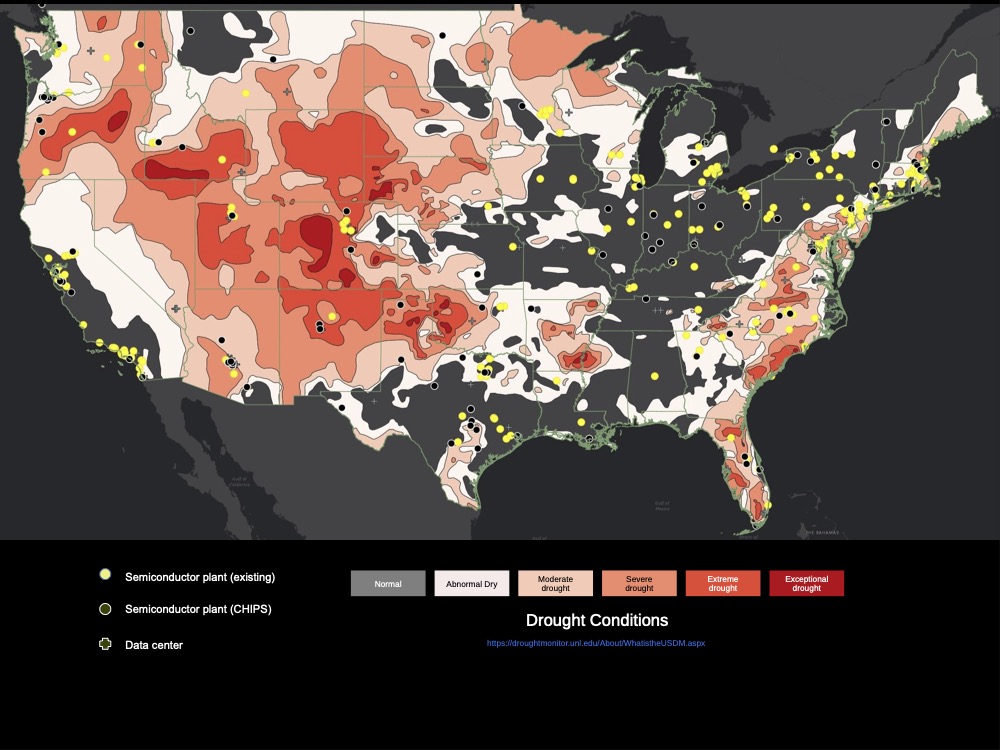
The map below shows the location of data centers and existing semiconductor facilities and those planned or under construction as a consequence of the CHIPS Act, according to data available from the Semiconductor Industry Association (see here and here). The map also shows only current drought conditions (not cumulative/long term conditions).
In 2025 Arizona’s Water Finance Authority announced that it was advancing into a “study phase” for water importation projects (Water Infrastructure Finance Authority of Arizona 2025). Public details about those projects are hosted on a dedicated website (Water Infrastructure Finance Authority of Arizona, n.d.). The projects selected for further study our led by two consortia “Acciona-Fengate Water Augmentation Alliance and EPCOR Water Innovation Partners” (Water Infrastructure Finance Authority of Arizona 2025). The proposed projects from both consortia involve transboundary shipments of desalinated seawater in conjunction with other sources of water importation to Arizona. The images below give you a sense of the magnitude and scale of the projects being contemplated.
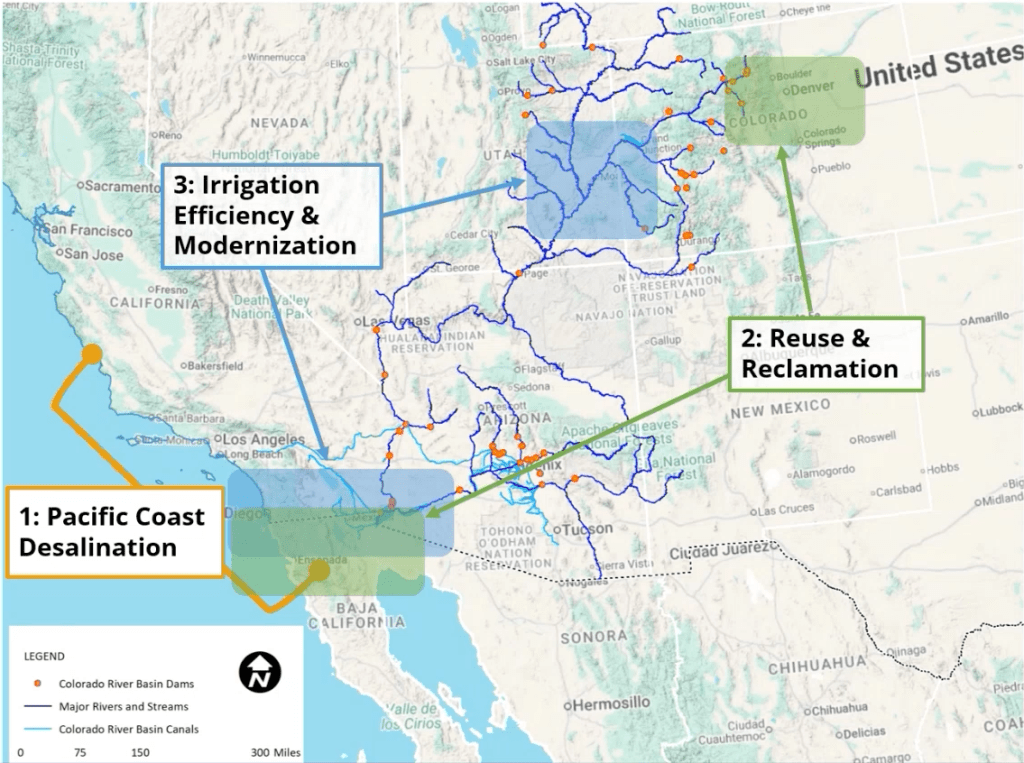

Now, obviously these water importation projects are not solely about semiconductors and data centres in Arizona. But both of those industries are certainly part of the picture. Looking upstream of those industries directs attention to the real material foundations on which all things digital are premised. At no point do these technologies escape their earthly dimensions. What’s more, looking ‘upstream’ in a somewhat more metaphorical sense enables an analysis of political – economic power that might otherwise be missed with an exclusive focus on the ‘tech’ sector. Both consortia represent private capital that, should these projects come to fruition, will come to have enormous power over all the people, places, and things that rely on the water their projects would import. These water importation projects also land on some potentially interesting further research issues. For example, both Fengate and EPCOR have Canadian roots. Fengate began as a property management business in Hamilton, Ontario. Since its founding it it has expanded into being an international investment company in infrastructure, private equity, and real estate. EPCOR, meanwhile, was originally founded as the Edmonton Electric Lighting and Power Company in 1891 and became a municipally owned public corporation in 1902. After its one-hundredth anniversary it was privatized in the mid-1990s and enters the US water market in 2011. So, upstream of Arizona’s water importation projects are two international investment companies founded in Canada where they both maintain operations to this day. The financialization of water infrastructure is a deeply contested process that turns a human need into an asset from which rent can be extracted for private gain (Loftus and March 2016; Pryke and Allen 2019).
It’s rare to see the importance of upstream sources of resource use or waste and pollution highlighted the way the Water Utility Report does relative to downstream consumer use and post-consumer discard. That’s one of the reasons that the Water Utility Report cited above is so important. It conveys an understanding that data centres are a politically visible and, therefore, useful organizing device for shaping coalitions that may bring together groups of people with otherwise wildly divergent politics. Property rights, cost-of-living, housing, habitat loss, fish ecology, noise pollution, chemical pollution, agricultural irrigation, drinking water… On their own, these and other issues don’t naturally or automatically bring together people in common cause. But houses for computers (data centres) can fuse all these issues together and, as a consequence, generate a political coalition that might not otherwise gel. That’s one of the reasons data centres have become so politically potent. They offer a tangible, highly visible entity for people with many different concerns to rally around. At the same time, the Water Utility Report correctly points out that elements upstream of data centres impact those same concerns (and others), but generally at a much greater magnitude. Data centres are basically housing for servers. Servers, like all computing devices, rely on semiconductors. Without semiconductors, there are no computing devices. And there are no semiconductors without water (or helium, or a myriad of other inputs). That’s all upstream of data centres. So, indeed, if your concern is water quality and the costs thereof, important questions are upstream of whatever is coming out of the tap.
Works Cited
Arizona Department of Water Resources. 2026. “ADWR Statement on Reclamation’s Final Environmental Impact Statement for Future Colorado River Operations.” Arizona Water News, July 31. https://azwaternews.com/2026/07/31/adwr-statement-feis/.
Bolster, By Jake. 2026. “Federal Plan Makes Steep Colorado River Water Cuts to Arizona, California and Nevada.” Inside Climate News, July 31. https://insideclimatenews.org/news/31072026/colorado-river-final-environmental-impact-statement/.
EWaste Phoenix (EWaste Phoenix). 2026. “Electronics Recycling & Hard Drive Shredding Phoenix AZ.” May 12. https://www.ewastephoenix.com/blog/e-waste-statistics-arizona.
Loftus, Alex, and Hug March. 2016. “Financializing Desalination: Rethinking the Returns of Big Infrastructure.” International Journal of Urban and Regional Research 40 (1): 46–61. https://doi.org/10.1111/1468-2427.12342.
Pryke, Michael, and John Allen. 2019. “Financialising Urban Water Infrastructure: Extracting Local Value, Distributing Value Globally.” Urban Studies 56 (7): 1326–46. https://doi.org/10.1177/0042098017742288.
United States Geological Survey. n.d. “National Mine Waste Inventory.” With Nick A. Karl, Autumn L. Helfrich, Carma A. San Juan, et al. U.S. Geological Survey. Xml,zip,csv,png. https://doi.org/10.5066/P148EEUA.
Water Infrastructure Finance Authority of Arizona. 2025. “WIFA Advances Water Importation Projects | Water Infrastructure Finance Authority.” November 19. https://wifa.az.gov/news/wifa-advances-water-importation-projects-0.
Water Infrastructure Finance Authority of Arizona. n.d. “Importation | Water Infrastructure Finance Authority.” Accessed August 7, 2026. https://wifa.az.gov/long-term-water-augmentation-fund/importation.
Water Utility Report. 2026. “Why the AI Chip Boom May Matter More Than Data Centers for Water Quality.” April 14. https://waterutilityreport.com/learn/ai-chip-boom-water-quality-story.
 Electronic Planet Research Lab
You must be logged in to post a comment.