
I have a paper published called, “Mapping chemical discardscapes of electronics production” (it’s free to download). It’s about pinpointing what researchers can learn about the electronics sector and the chemicals that are released during the manufacturing of electronics. I use publicly available data that you might be interested in using for your own research. Here’s what you need to know to get your own data.
The data come from the Commission for Environmental Cooperation (CEC, a quasi-governmental body set up under the North America Free Trade Agreement. You can learn more about it here and in my paper). The data I was interested in come from the electronics sector, but many other sectors are represented in the CEC dataset.
First, navigate to the CEC Taking Stock database. Once there, you have a large number of variables you can choose from. I’ve used screenshots to show you what I selected to download data for my analysis.
I was interested in facility level data. This gives you information on the releases and transfers of pollutants from individual facilities where ever they are located in the NAFTA region.
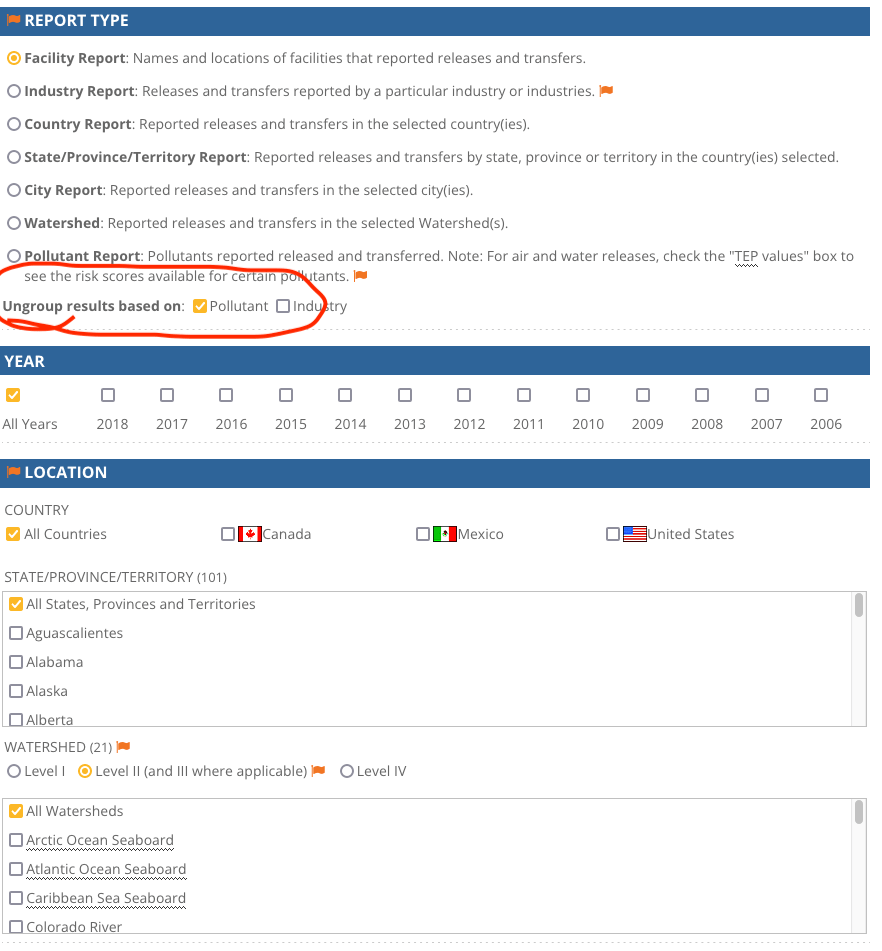
I wanted data for all years (when I wrote my paper they were only available to the year 2017; CEC data are usually a couple of years behind whatever the current calendar year is).
In terms of location I wanted data for all countries in the region (although I am offered the option of looking at individual watersheds that variable was not of primary interest to me).
I wanted all pollutant types ungrouped by pollutant (see the area circled in red in the image above). This just means that the data are disaggregated chemical-by-chemical rather than combining them all into a single total value for weight. It’s also helpful to include the CAS number. The CAS number is an individual identifier given to particular chemical pollutants (more about CAS here). Not all pollutants have such a number but many do, and having the CAS number can be useful for distinguishing what different types of pollution data you have. It is not necessary to have a CAS number but it can help for certain analyses (see area circled in red in image below).
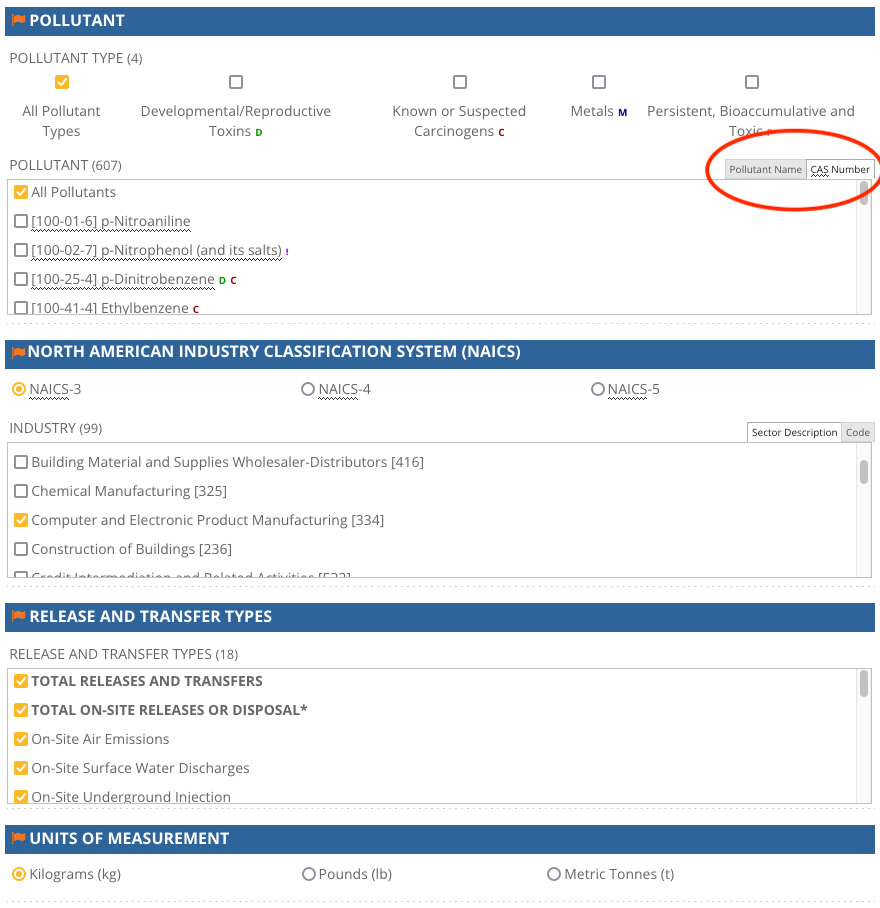
Next is the option for what industry you want to look at. It is possible to look at all industries included in the dataset, but I was only interested in the “Computer and Electronic Product Manufacturing” sector. That sector is designated as NAICS-3 [334]. NAICS refers to the North American Industry Classification System. NAICS is a standard used in a lot of economics research. You can find out more about NAICS here.
Finally, in terms of release and transfer types I wanted all of the individual release and transfer types (e.g., total releases and transfers but also on-site air emissions, on-site surface water discharge etc). That means selecting all of them individually. I used the default units of measurement which are kilograms. You can see a “QUERY SUMMARY” of your data selections after you make them and before you click “Submit” to be sure you have what you want.

Once you have selected all of the variables you are interested in click “Submit”.
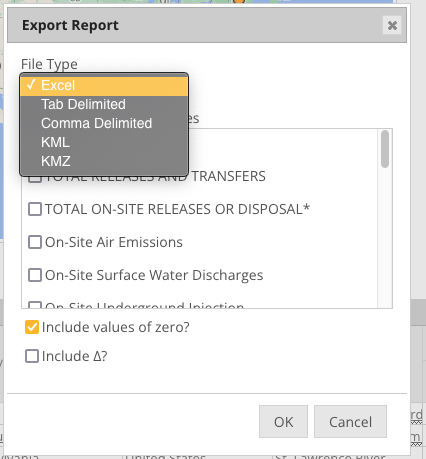
On the next screen you will see that there is an option to export the data. If you click on the menu there are a variety of file formats you can choose from. I downloaded Excel and Comma Delimited. You can also download KML or KMZ, both of which are Google Earth file formats. However those options are only available if you do not select all the on-site and offsite options. This is not such a big deal though because the data you download will include latitude and longitude for each individual facility anyway, so, if you’re interested in mapping or GIS the data are readily formatted for those kinds of applications without the need for KML or KMZ.
Before you go much further, it is really important to understand the opportunities and the limits that are built into these data. I get into a lot of this in my paper, but at a minimum I recommend you have a look at what the CEC itself says at the bottom of the main data selection menus. Even better, read “Understanding Taking Stock” and consult Appendix 1 of:
CEC. 2018. “Taking Stock | North American Pollutant Releases and Transfers.” 15. Montreal, Canada: Commission for Environmental Cooperation.
Once you have the data and understand both its possibilities and limits, you’re ready for some analysis. Here’s one map I made from the data and included in my paper on chemical releases from electronics manufacturing:

You can find an interactive version of the map above as well as the data used to create it and all the figures in the original paper on my public Tableau repository.

You must be logged in to post a comment.